यह ब्लॉग एक बहु-श्रृंखला शुरू करता है जो क्लाउड में पोस्टग्रेएसक्यूएल बेंचमार्किंग पर मेरी यात्रा का दस्तावेजीकरण करता है।
पहले भाग में बेंचमार्किंग टूल का अवलोकन शामिल है, और Amazon Aurora PostgreSQL के साथ मज़ा शुरू करता है।
PostgreSQL क्लाउड सेवा प्रदाताओं का चयन करना
कुछ समय पहले मुझे औरोरा के लिए AWS बेंचमार्क प्रक्रिया का पता चला, और मैंने सोचा कि यह वास्तव में अच्छा होगा यदि मैं उस परीक्षा को दे सकूं और इसे अन्य क्लाउड होस्टिंग प्रदाताओं पर चला सकूं। Amazon के श्रेय के लिए, तीन सबसे प्रसिद्ध उपयोगिता कंप्यूटिंग प्रदाताओं में से - AWS, Google और Microsoft - AWS PostgreSQL के विकास में एकमात्र प्रमुख योगदानकर्ता है, और प्रबंधित PostgreSQL सेवा (नवंबर 2013 में वापस डेटिंग) की पेशकश करने वाला पहला है।
जबकि प्रबंधित पोस्टग्रेएसक्यूएल सेवाएं पोस्टग्रेएसक्यूएल होस्टिंग प्रदाताओं के ढेरों से भी उपलब्ध हैं, मैं उक्त तीन क्लाउड कंप्यूटिंग प्रदाताओं पर ध्यान केंद्रित करना चाहता था क्योंकि उनके वातावरण ऐसे हैं जहां क्लाउड कंप्यूटिंग के लाभों की तलाश करने वाले कई संगठन अपने अनुप्रयोगों को चलाने के लिए चुनते हैं, बशर्ते कि उनके पास हो PostgreSQL के प्रबंधन पर आवश्यक जानकारी। मेरा दृढ़ विश्वास है कि आज के आईटी परिदृश्य में, क्लाउड में महत्वपूर्ण कार्यभार के साथ काम करने वाले संगठनों को एक विशेष पोस्टग्रेएसक्यूएल सेवा प्रदाता की सेवाओं से बहुत लाभ होगा, जो उन्हें जीयूसीएस की जटिल दुनिया और स्लाइडशेयर प्रस्तुतियों के असंख्य नेविगेट करने में मदद कर सकता है।
सही बेंचमार्क टूल चुनना
बेंचमार्किंग पोस्टग्रेएसक्यूएल अक्सर प्रदर्शन मेलिंग सूची पर आता है, और अनगिनत बार तनाव के रूप में परीक्षण वास्तविक जीवन अनुप्रयोग के लिए कॉन्फ़िगरेशन को सत्यापित करने का इरादा नहीं रखते हैं। हालांकि, सार्थक परिणाम प्राप्त करने के लिए सही बेंचमार्क टूल और पैरामीटर का चयन करना महत्वपूर्ण है। मैं उम्मीद करता हूं कि प्रत्येक क्लाउड प्रदाता अपनी सेवाओं को बेंचमार्क करने के लिए प्रक्रियाएं प्रदान करेगा, खासकर जब पहला क्लाउड अनुभव दाहिने पैर से शुरू नहीं हो सकता है। अच्छी खबर यह है कि इस टेस्ट में तीन में से दो खिलाड़ियों ने अपने दस्तावेज़ीकरण में बेंचमार्क शामिल किए हैं। ऑरोरा गाइड के लिए एडब्ल्यूएस बेंचमार्क प्रक्रिया को खोजना आसान है, जो सीधे अमेज़न ऑरोरा रिसोर्सेज पेज पर उपलब्ध है। Google PostgreSQL के लिए विशिष्ट मार्गदर्शिका प्रदान नहीं करता है, हालांकि, Compute Engine दस्तावेज़ में HammerDB पर आधारित SQL सर्वर के लिए लोड परीक्षण मार्गदर्शिका शामिल है।
निम्नलिखित उनके संदर्भों के आधार पर बेंचमार्क टूल का सारांश देखने लायक है:
- ऊपर उल्लिखित AWS बेंचमार्क pgbench और sysbench पर आधारित है।
- HammerDB, जिसका उल्लेख पहले भी किया गया है, पर हाल ही में pgsql-hackers सूची पर एक पोस्ट में चर्चा की गई है।
- इस अन्य pgsql-hackers चर्चा में बताए गए oltpbench पर आधारित TPC-C परीक्षण।
- बेंचमार्कस्क्ल एक और टीपीसी-सी परीक्षण है जिसका उपयोग बी-ट्री पेज स्प्लिट्स में परिवर्तनों को मान्य करने के लिए किया गया था।
- pg_ycsb शहर में नया बच्चा है, pgbench में सुधार कर रहा है और पहले से ही कुछ PostgreSQL हैकर द्वारा उपयोग किया जा रहा है।
- pgbench-tools जैसा कि नाम से पता चलता है, pgbench पर आधारित है और 2016 से कोई अपडेट प्राप्त नहीं होने पर, यह PostgreSQL उच्च प्रदर्शन पुस्तकों के लेखक ग्रेग स्मिथ का उत्पाद है।
- जॉइन ऑर्डर बेंचमार्क एक बेंचमार्क है जो क्वेरी ऑप्टिमाइज़र का परीक्षण करेगा।
- कमांड प्रॉम्प्ट ब्लॉग पढ़ते समय मुझे जो pgreplay मिला, वह उतना ही करीब है जितना कि यह वास्तविक जीवन परिदृश्य को बेंचमार्क करने के लिए मिल सकता है।
एक और ध्यान देने वाली बात यह है कि PostgreSQL अभी तक TPC-H बेंचमार्क मानक के लिए उपयुक्त नहीं है, और जैसा कि ऊपर बताया गया है कि सभी टूल्स (pgreplay को छोड़कर) को TPC-C मोड में चलाना चाहिए (pgbench डिफ़ॉल्ट रूप से)।
इस ब्लॉग के उद्देश्य के लिए, मैंने सोचा था कि AWS बेंचमार्क प्रक्रिया Aurora के लिए एक अच्छी शुरुआत है क्योंकि यह क्लाउड प्रदाताओं के लिए एक मानक निर्धारित करती है और व्यापक रूप से उपयोग किए जाने वाले टूल पर आधारित है।
इसके अलावा, मैंने उस समय नवीनतम उपलब्ध PostgreSQL संस्करण का उपयोग किया था। क्लाउड प्रदाता का चयन करते समय, उन्नयन की आवृत्ति पर विचार करना महत्वपूर्ण है, खासकर जब नए संस्करणों द्वारा शुरू की गई महत्वपूर्ण विशेषताएं प्रदर्शन को प्रभावित कर सकती हैं (जो कि संस्करण 10 और 11 बनाम 9 के मामले में है)। इस लेखन के रूप में हमारे पास है:
- अमेज़ॅन ऑरोरा पोस्टग्रेएसक्यूएल 10.6
- PostgreSQL 10.6 के लिए Amazon RDS
- PostgreSQL 9.6 के लिए Google क्लाउड SQL
- Microsoft Azure PostgreSQL 10.5
...और यहां विजेता सबसे हाल के संस्करण की पेशकश करके एडब्ल्यूएस है (हालांकि यह नवीनतम नहीं है, जो इस लेखन के अनुसार 11.2 है)।
बेंचमार्किंग परिवेश सेट करना
मैंने कुछ कारणों से अपने परीक्षणों को औसत कार्यभार तक सीमित करने का निर्णय लिया:पहला, उपलब्ध क्लाउड संसाधन प्रदाताओं में समान नहीं हैं। गाइड में, डेटाबेस इंस्टेंस के लिए AWS स्पेक्स 64 vCPU / 488 GiB RAM / 25 Gigabit नेटवर्क हैं, जबकि किसी भी इंस्टेंस आकार के लिए Google की अधिकतम RAM (Google कैलकुलेटर में "कस्टम" पर सेट होना चाहिए) 208 GiB है, और 32 वीसीपीयू पर माइक्रोसॉफ्ट का बिजनेस क्रिटिकल जेन5 केवल 163 जीआईबी के साथ आता है)। दूसरा, pgbench इनिशियलाइज़ेशन डेटाबेस का आकार 160GiB तक लाता है, जो कि 488 GiB RAM के साथ एक उदाहरण के मामले में मेमोरी में संग्रहीत होने की संभावना है।
इसके अलावा, मैंने PostgreSQL कॉन्फ़िगरेशन को अछूता छोड़ दिया। क्लाउड प्रदाता की चूक से चिपके रहने का कारण यह है कि, बॉक्स से बाहर, जब एक मानक बेंचमार्क द्वारा जोर दिया जाता है, तो एक प्रबंधित सेवा से उचित रूप से अच्छा प्रदर्शन करने की उम्मीद की जाती है। याद रखें कि PostgreSQL समुदाय रिलीज प्रबंधन प्रक्रिया के हिस्से के रूप में pgbench परीक्षण चलाता है। इसके अतिरिक्त, AWS मार्गदर्शिका डिफ़ॉल्ट PostgreSQL कॉन्फ़िगरेशन में किसी भी परिवर्तन का उल्लेख नहीं करती है।
जैसा कि गाइड में बताया गया है, AWS ने pgbench पर दो पैच लागू किए। चूंकि ग्राहकों की संख्या के लिए पैच PostgreSQL के 10.6 संस्करण पर स्पष्ट रूप से लागू नहीं हुआ था और मैं इसे ठीक करने में समय नहीं लगाना चाहता था, इसलिए ग्राहकों की संख्या अधिकतम 1,000 तक सीमित थी।
मार्गदर्शिका क्लाइंट इंस्टेंस के लिए उन्नत नेटवर्किंग सक्षम करने की आवश्यकता निर्दिष्ट करती है - इस इंस्टेंस प्रकार के लिए जो डिफ़ॉल्ट है:
[example@sqldat.com ~]$ ip a
1: lo: <LOOPBACK,UP,LOWER_UP> mtu 65536 qdisc noqueue state UNKNOWN group default qlen 1000
    link/loopback 00:00:00:00:00:00 brd 00:00:00:00:00:00
    inet 127.0.0.1/8 scope host lo
       valid_lft forever preferred_lft forever
    inet6 ::1/128 scope host
       valid_lft forever preferred_lft forever
2: eth0: <BROADCAST,MULTICAST,UP,LOWER_UP> mtu 9001 qdisc mq state UP group default qlen 1000
    link/ether 0a:cd:ee:40:2b:e6 brd ff:ff:ff:ff:ff:ff
    inet 172.31.19.190/20 brd 172.31.31.255 scope global eth0
       valid_lft forever preferred_lft forever
    inet6 fe80::8cd:eeff:fe40:2be6/64 scope link
       valid_lft forever preferred_lft forever
[example@sqldat.com ~]$ ethtool -i eth0
driver: ena
version: 2.0.2g
firmware-version:
bus-info: 0000:00:03.0
supports-statistics: yes
supports-test: no
supports-eeprom-access: no
supports-register-dump: no
supports-priv-flags: no
>>> aws (master *%) ~ $ aws ec2 describe-instances --instance-ids i-0ee51642334c1ec57 --query "Reservations[].Instances[].EnaSupport"
[
    true
]
Amazon Aurora PostgreSQL पर बेंचमार्क चलाना
वास्तविक दौड़ के दौरान मैंने गाइड से एक और विचलन करने का फैसला किया:1 घंटे के लिए परीक्षण चलाने के बजाय 10 मिनट की समय सीमा निर्धारित करें, जिसे आम तौर पर एक अच्छे मूल्य के रूप में स्वीकार किया जाता है।
#1 भागो
विशिष्टता
- यह परीक्षण क्लाइंट और डेटाबेस इंस्टेंस आकार दोनों के लिए AWS विनिर्देशों का उपयोग करता है।
- क्लाइंट मशीन:ऑन डिमांड मेमोरी ऑप्टिमाइज्ड ईसी2 इंस्टेंस:
- vCPU:32 (16 करोड़ x 2 थ्रेड/कोर)
- रैम:244 जीआईबी
- संग्रहण:ईबीएस अनुकूलित
- नेटवर्क:10 गीगाबिट
- डीबी क्लस्टर:db.r4.16xबड़ा
- वीसीपीयू:64
- ECU (CPU क्षमता):195 x [1.0-1.2 GHz] 2007 Opteron / Xeon
- रैम:488 जीआईबी
- संग्रहण:ईबीएस अनुकूलित (I/O के लिए समर्पित क्षमता)
- नेटवर्क:25 जीपीएस नेटवर्क पर 14,000 एमबीपीएस अधिकतम बैंडविड्थ
- क्लाइंट मशीन:ऑन डिमांड मेमोरी ऑप्टिमाइज्ड ईसी2 इंस्टेंस:
- डेटाबेस सेटअप में एक प्रतिकृति शामिल है।
- डेटाबेस संग्रहण एन्क्रिप्ट नहीं किया गया था।
परीक्षा और परिणाम प्रदर्शन करना
- pgbench और sysbench इंस्टॉल करने के लिए गाइड में दिए गए निर्देशों का पालन करें।
- डेटाबेस कनेक्शन के लिए पर्यावरण चर सेट करने के लिए ~/.bashrc संपादित करें और PostgreSQL पुस्तकालयों के लिए आवश्यक पथ:
export PGHOST=aurora.cluster-ctfirtyhadgr.us-east-1.rds.amazonaws.com export PGUSER=postgres export PGPASSWORD=postgres export PGDATABASE=postgres export PATH=$PATH:/usr/local/pgsql/bin export LD_LIBRARY_PATH=$LD_LIBRARY_PATH:/usr/local/pgsql/lib - डेटाबेस को इनिशियलाइज़ करें:
[example@sqldat.com ~]# pgbench -i --fillfactor=90 --scale=10000 NOTICE: table "pgbench_history" does not exist, skipping NOTICE: table "pgbench_tellers" does not exist, skipping NOTICE: table "pgbench_accounts" does not exist, skipping NOTICE: table "pgbench_branches" does not exist, skipping creating tables... 100000 of 1000000000 tuples (0%) done (elapsed 0.05 s, remaining 457.23 s) 200000 of 1000000000 tuples (0%) done (elapsed 0.13 s, remaining 631.70 s) 300000 of 1000000000 tuples (0%) done (elapsed 0.21 s, remaining 688.29 s) ... 999500000 of 1000000000 tuples (99%) done (elapsed 811.41 s, remaining 0.41 s) 999600000 of 1000000000 tuples (99%) done (elapsed 811.50 s, remaining 0.32 s) 999700000 of 1000000000 tuples (99%) done (elapsed 811.58 s, remaining 0.24 s) 999800000 of 1000000000 tuples (99%) done (elapsed 811.65 s, remaining 0.16 s) 999900000 of 1000000000 tuples (99%) done (elapsed 811.73 s, remaining 0.08 s) 1000000000 of 1000000000 tuples (100%) done (elapsed 811.80 s, remaining 0.00 s) vacuum... set primary keys... done. - डेटाबेस का आकार सत्यापित करें:
postgres=> \l+ postgres List of databases Name | Owner | Encoding | Collate | Ctype | Access privileges | Size | Tablespace | Description ----------+----------+----------+-------------+-------------+-------------------+--------+------------+-------------------------------------------- postgres | postgres | UTF8 | en_US.UTF-8 | en_US.UTF-8 | | 160 GB | pg_default | default administrative connection database (1 row) - निम्न क्वेरी का उपयोग यह सत्यापित करने के लिए करें कि चौकियों के बीच का समय अंतराल सेट किया गया है ताकि 10 मिनट की दौड़ के दौरान चौकियों को मजबूर किया जा सके:
परिणाम:SELECT total_checkpoints, seconds_since_start / total_checkpoints / 60 AS minutes_between_checkpoints FROM ( SELECT EXTRACT( EPOCH FROM ( now() - pg_postmaster_start_time() ) ) AS seconds_since_start, (checkpoints_timed+checkpoints_req) AS total_checkpoints FROM pg_stat_bgwriter) AS sub;postgres=> \e total_checkpoints | minutes_between_checkpoints -------------------+----------------------------- 50 | 0.977392292333333 (1 row) - पढ़ें/लिखें कार्यभार चलाएं:
आउटपुट[example@sqldat.com ~]# pgbench --protocol=prepared -P 60 --time=600 --client=1000 --jobs=2048starting vacuum...end. progress: 60.0 s, 35670.3 tps, lat 27.243 ms stddev 10.915 progress: 120.0 s, 36569.5 tps, lat 27.352 ms stddev 11.859 progress: 180.0 s, 35845.2 tps, lat 27.896 ms stddev 12.785 progress: 240.0 s, 36613.7 tps, lat 27.310 ms stddev 11.804 progress: 300.0 s, 37323.4 tps, lat 26.793 ms stddev 11.376 progress: 360.0 s, 36828.8 tps, lat 27.155 ms stddev 11.318 progress: 420.0 s, 36670.7 tps, lat 27.268 ms stddev 12.083 progress: 480.0 s, 37176.1 tps, lat 26.899 ms stddev 10.981 progress: 540.0 s, 37210.8 tps, lat 26.875 ms stddev 11.341 progress: 600.0 s, 37415.4 tps, lat 26.727 ms stddev 11.521 transaction type: <builtin: TPC-B (sort of)> scaling factor: 10000 query mode: prepared number of clients: 1000 number of threads: 1000 duration: 600 s number of transactions actually processed: 22040445 latency average = 27.149 ms latency stddev = 11.617 ms tps = 36710.828624 (including connections establishing) tps = 36811.054851 (excluding connections establishing) - sysbench परीक्षण तैयार करें:
आउटपुट:sysbench --test=/usr/local/share/sysbench/oltp.lua \ --pgsql-host=aurora.cluster-ctfirtyhadgr.us-east-1.rds.amazonaws.com \ --pgsql-db=postgres \ --pgsql-user=postgres \ --pgsql-password=postgres \ --pgsql-port=5432 \ --oltp-tables-count=250\ --oltp-table-size=450000 \ preparesysbench 0.5: multi-threaded system evaluation benchmark Creating table 'sbtest1'... Inserting 450000 records into 'sbtest1' Creating secondary indexes on 'sbtest1'... Creating table 'sbtest2'... ... Creating table 'sbtest250'... Inserting 450000 records into 'sbtest250' Creating secondary indexes on 'sbtest250'... - sysbench परीक्षण चलाएँ:
आउटपुट:sysbench --test=/usr/local/share/sysbench/oltp.lua \ --pgsql-host=aurora.cluster-ctfirtyhadgr.us-east-1.rds.amazonaws.com \ --pgsql-db=postgres \ --pgsql-user=postgres \ --pgsql-password=postgres \ --pgsql-port=5432 \ --oltp-tables-count=250 \ --oltp-table-size=450000 \ --max-requests=0 \ --forced-shutdown \ --report-interval=60 \ --oltp_simple_ranges=0 \ --oltp-distinct-ranges=0 \ --oltp-sum-ranges=0 \ --oltp-order-ranges=0 \ --oltp-point-selects=0 \ --rand-type=uniform \ --max-time=600 \ --num-threads=1000 \ runsysbench 0.5: multi-threaded system evaluation benchmark Running the test with following options: Number of threads: 1000 Report intermediate results every 60 second(s) Random number generator seed is 0 and will be ignored Forcing shutdown in 630 seconds Initializing worker threads... Threads started! [ 60s] threads: 1000, tps: 20443.09, reads: 0.00, writes: 81834.16, response time: 68.24ms (95%), errors: 0.62, reconnects: 0.00 [ 120s] threads: 1000, tps: 20580.68, reads: 0.00, writes: 82324.33, response time: 70.75ms (95%), errors: 0.73, reconnects: 0.00 [ 180s] threads: 1000, tps: 20531.85, reads: 0.00, writes: 82127.21, response time: 70.63ms (95%), errors: 0.73, reconnects: 0.00 [ 240s] threads: 1000, tps: 20212.67, reads: 0.00, writes: 80861.67, response time: 71.99ms (95%), errors: 0.43, reconnects: 0.00 [ 300s] threads: 1000, tps: 19383.90, reads: 0.00, writes: 77537.87, response time: 75.64ms (95%), errors: 0.75, reconnects: 0.00 [ 360s] threads: 1000, tps: 19797.20, reads: 0.00, writes: 79190.78, response time: 75.27ms (95%), errors: 0.68, reconnects: 0.00 [ 420s] threads: 1000, tps: 20304.43, reads: 0.00, writes: 81212.87, response time: 73.82ms (95%), errors: 0.70, reconnects: 0.00 [ 480s] threads: 1000, tps: 20933.80, reads: 0.00, writes: 83737.16, response time: 74.71ms (95%), errors: 0.68, reconnects: 0.00 [ 540s] threads: 1000, tps: 20663.05, reads: 0.00, writes: 82626.42, response time: 73.56ms (95%), errors: 0.75, reconnects: 0.00 [ 600s] threads: 1000, tps: 20746.02, reads: 0.00, writes: 83015.81, response time: 73.58ms (95%), errors: 0.78, reconnects: 0.00 OLTP test statistics: queries performed: read: 0 write: 48868458 other: 24434022 total: 73302480 transactions: 12216804 (20359.59 per sec.) read/write requests: 48868458 (81440.43 per sec.) other operations: 24434022 (40719.87 per sec.) ignored errors: 414 (0.69 per sec.) reconnects: 0 (0.00 per sec.) General statistics: total time: 600.0516s total number of events: 12216804 total time taken by event execution: 599964.4735s response time: min: 6.27ms avg: 49.11ms max: 350.24ms approx. 95 percentile: 72.90ms Threads fairness: events (avg/stddev): 12216.8040/31.27 execution time (avg/stddev): 599.9645/0.01
संग्रहित मीट्रिक
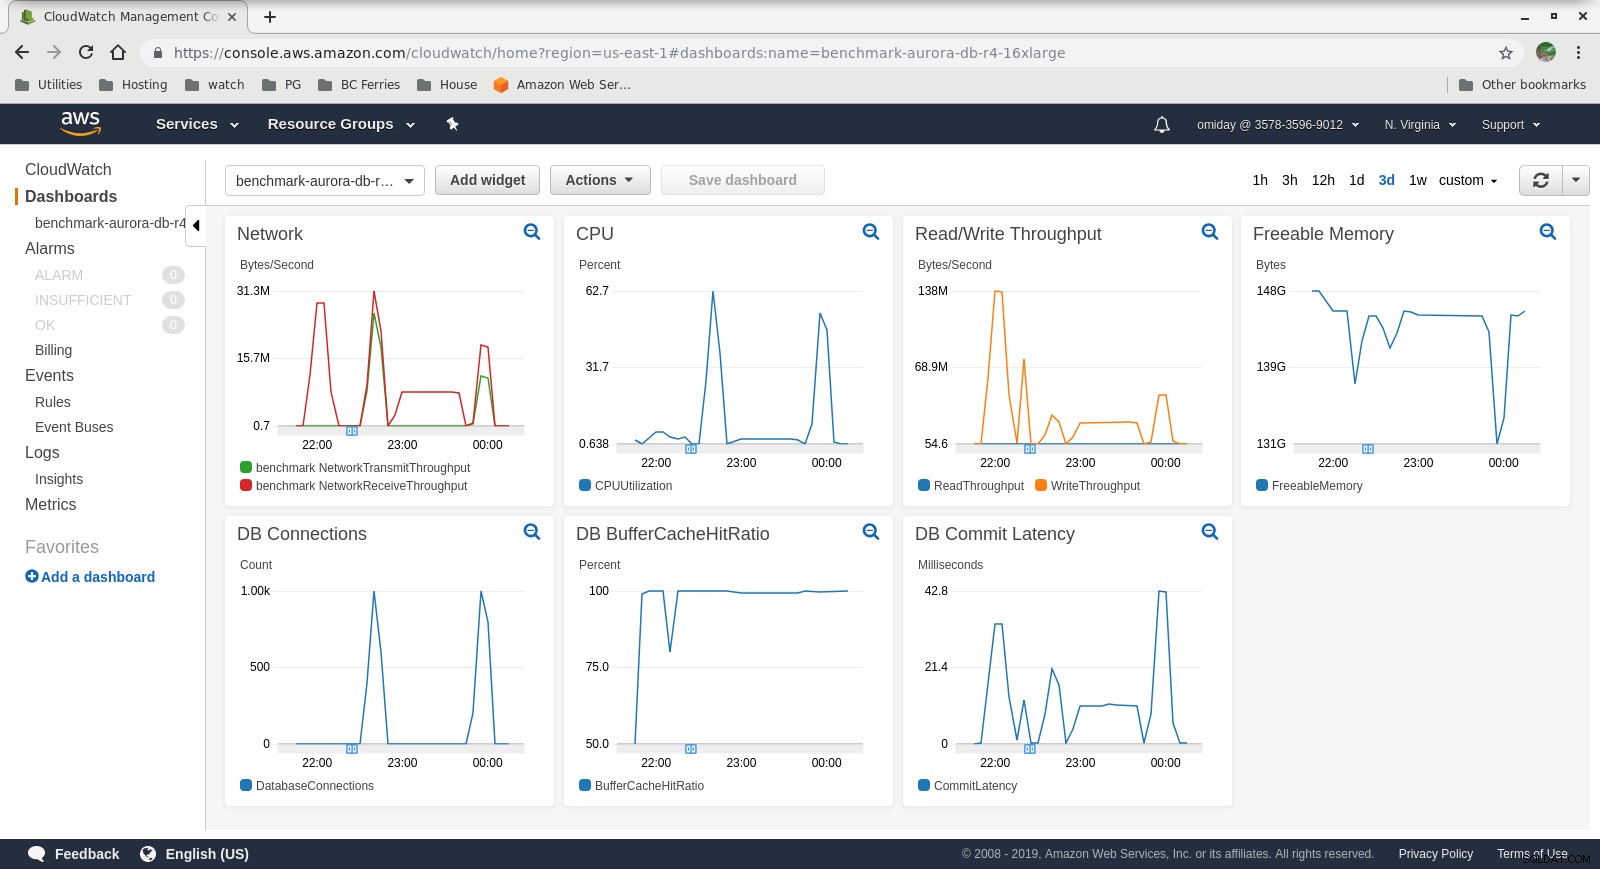 क्लाउडवॉच मेट्रिक्स
 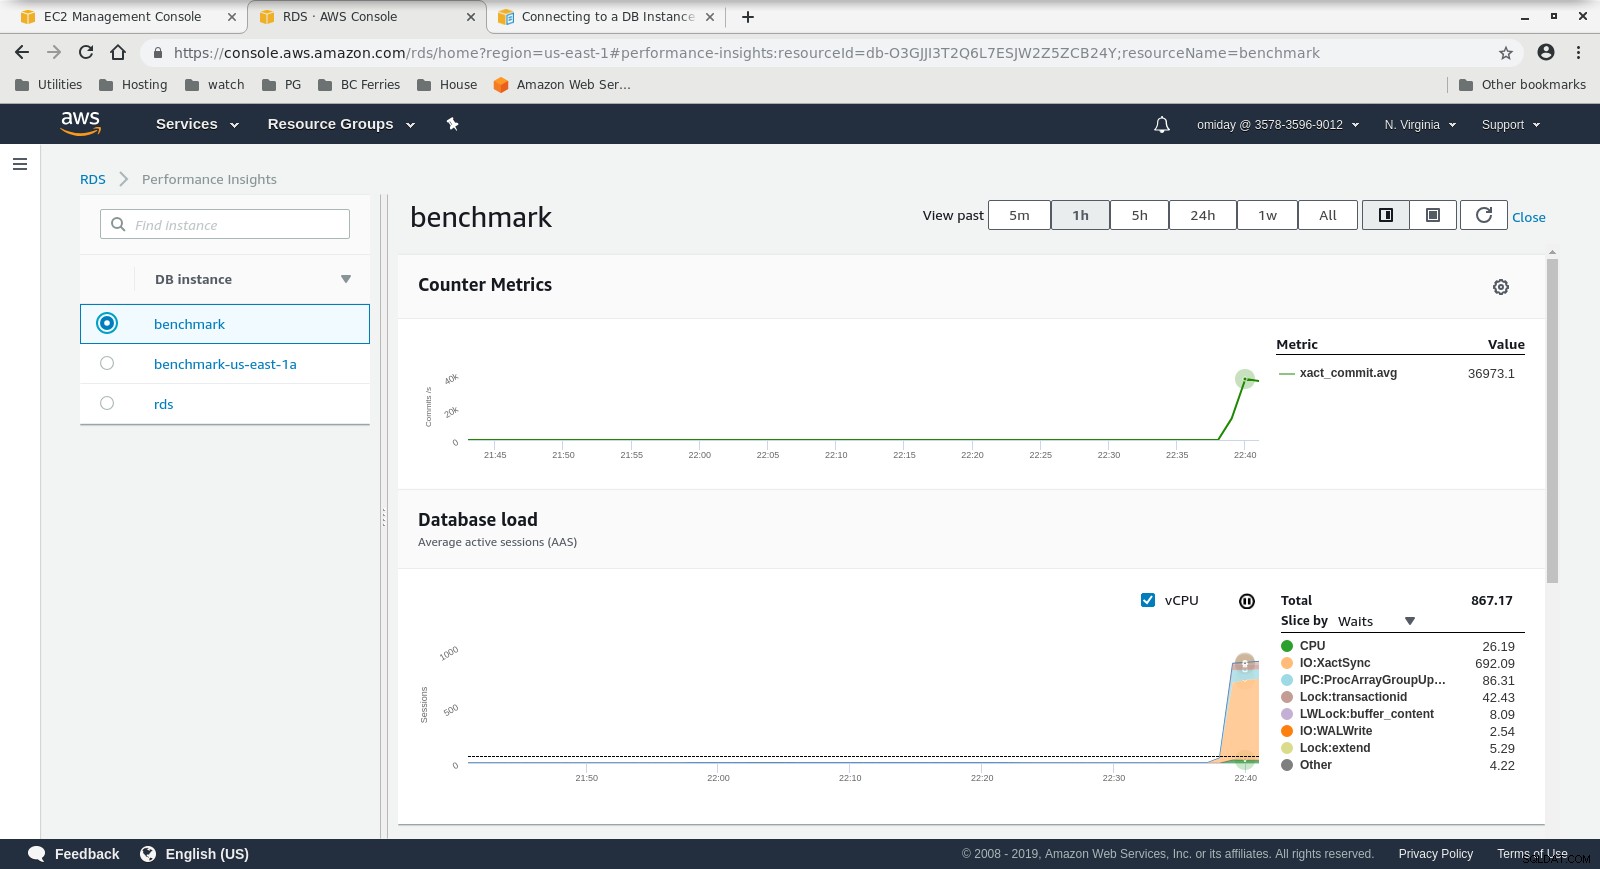 परफॉर्मेंस इनसाइट मेट्रिक्स आज व्हाइटपेपर डाउनलोड करें क्लस्टरकंट्रोल के साथ पोस्टग्रेएसक्यूएल मैनेजमेंट एंड ऑटोमेशन इस बारे में जानें कि परिनियोजित करने, मॉनिटर करने के लिए आपको क्या जानना चाहिए, PostgreSQL को प्रबंधित और स्केल करें श्वेतपत्र डाउनलोड करें
 #2 भागो
विशिष्टता
- यह परीक्षण क्लाइंट के लिए AWS विनिर्देशों और डेटाबेस के लिए एक छोटे इंस्टेंस आकार का उपयोग करता है:
- क्लाइंट मशीन:ऑन डिमांड मेमोरी ऑप्टिमाइज्ड ईसी2 इंस्टेंस:
- vCPU:32 (16 करोड़ x 2 थ्रेड/कोर)
- रैम:244 जीआईबी
- संग्रहण:ईबीएस अनुकूलित
- नेटवर्क:10 गीगाबिट
- डीबी क्लस्टर:db.r4.2xबड़ा:
- vCPU:8
- रैम:61GiB
- संग्रहण:ईबीएस अनुकूलित
- नेटवर्क:अधिकतम 10 जीबीपीएस कनेक्शन पर 1,750 एमबीपीएस अधिकतम बैंडविड्थ
- क्लाइंट मशीन:ऑन डिमांड मेमोरी ऑप्टिमाइज्ड ईसी2 इंस्टेंस:
- डेटाबेस में प्रतिकृति शामिल नहीं थी।
- डेटाबेस संग्रहण एन्क्रिप्ट नहीं किया गया था।
परीक्षा और परिणाम प्रदर्शन करना
चरण # 1 चलाने के समान हैं इसलिए मैं केवल आउटपुट दिखा रहा हूं:
-
pgbench कार्यभार पढ़ें/लिखें:
...

745700000 of 1000000000 tuples (74%) done (elapsed 794.93 s, remaining 271.09 s)
745800000 of 1000000000 tuples (74%) done (elapsed 795.00 s, remaining 270.97 s)
745900000 of 1000000000 tuples (74%) done (elapsed 795.09 s, remaining 270.86 s)
746000000 of 1000000000 tuples (74%) done (elapsed 795.17 s, remaining 270.74 s)
746100000 of 1000000000 tuples (74%) done (elapsed 795.24 s, remaining 270.62 s)
746200000 of 1000000000 tuples (74%) done (elapsed 795.33 s, remaining 270.51 s)

...

999800000 of 1000000000 tuples (99%) done (elapsed 1067.11 s, remaining 0.21 s)
999900000 of 1000000000 tuples (99%) done (elapsed 1067.19 s, remaining 0.11 s)
1000000000 of 1000000000 tuples (100%) done (elapsed 1067.28 s, remaining 0.00 s)
vacuum...
set primary keys...
total time: 4386.44 s (insert 1067.33 s, commit 0.46 s, vacuum 2088.25 s, index 1230.41 s)
done.
starting vacuum...end. progress: 60.0 s, 3361.3 tps, lat 286.143 ms stddev 80.417 progress: 120.0 s, 3466.8 tps, lat 288.386 ms stddev 76.373 progress: 180.0 s, 3683.1 tps, lat 271.840 ms stddev 75.712 progress: 240.0 s, 3444.3 tps, lat 289.909 ms stddev 69.564 progress: 300.0 s, 3475.8 tps, lat 287.736 ms stddev 73.712 progress: 360.0 s, 3449.5 tps, lat 289.832 ms stddev 71.878 progress: 420.0 s, 3518.1 tps, lat 284.432 ms stddev 74.276 progress: 480.0 s, 3430.7 tps, lat 291.359 ms stddev 73.264 progress: 540.0 s, 3515.7 tps, lat 284.522 ms stddev 73.206 progress: 600.0 s, 3482.9 tps, lat 287.037 ms stddev 71.649 transaction type: <builtin: TPC-B (sort of)> scaling factor: 10000 query mode: prepared number of clients: 1000 number of threads: 1000 duration: 600 s number of transactions actually processed: 2090702 latency average = 286.030 ms latency stddev = 74.245 ms tps = 3481.731730 (including connections establishing) tps = 3494.157830 (excluding connections establishing) -
सिसबेंच परीक्षण:
sysbench 0.5:  multi-threaded system evaluation benchmark

Running the test with following options:
Number of threads: 1000
Report intermediate results every 60 second(s)
Random number generator seed is 0 and will be ignored

Forcing shutdown in 630 seconds

Initializing worker threads...

Threads started!

[  60s] threads: 1000, tps: 4809.05, reads: 0.00, writes: 19301.02, response time: 288.03ms (95%), errors: 0.05, reconnects:  0.00
[ 120s] threads: 1000, tps: 5264.15, reads: 0.00, writes: 21005.40, response time: 255.23ms (95%), errors: 0.08, reconnects:  0.00
[ 180s] threads: 1000, tps: 5178.27, reads: 0.00, writes: 20713.07, response time: 260.40ms (95%), errors: 0.03, reconnects:  0.00
[ 240s] threads: 1000, tps: 5145.95, reads: 0.00, writes: 20610.08, response time: 255.76ms (95%), errors: 0.05, reconnects:  0.00
[ 300s] threads: 1000, tps: 5127.92, reads: 0.00, writes: 20507.98, response time: 264.24ms (95%), errors: 0.05, reconnects:  0.00
[ 360s] threads: 1000, tps: 5063.83, reads: 0.00, writes: 20278.10, response time: 268.55ms (95%), errors: 0.05, reconnects:  0.00
[ 420s] threads: 1000, tps: 5057.51, reads: 0.00, writes: 20237.28, response time: 269.19ms (95%), errors: 0.10, reconnects:  0.00
[ 480s] threads: 1000, tps: 5036.32, reads: 0.00, writes: 20139.29, response time: 279.62ms (95%), errors: 0.10, reconnects:  0.00
[ 540s] threads: 1000, tps: 5115.25, reads: 0.00, writes: 20459.05, response time: 264.64ms (95%), errors: 0.08, reconnects:  0.00
[ 600s] threads: 1000, tps: 5124.89, reads: 0.00, writes: 20510.07, response time: 265.43ms (95%), errors: 0.10, reconnects:  0.00
OLTP test statistics:
    queries performed:
        read:                            0
        write:                           12225686
        other:                           6112822
        total:                           18338508
    transactions:                        3056390 (5093.75 per sec.)
    read/write requests:                 12225686 (20375.20 per sec.)
    other operations:                    6112822 (10187.57 per sec.)
    ignored errors:                      42     (0.07 per sec.)
    reconnects:                          0      (0.00 per sec.)

General statistics:
    total time:                          600.0277s
    total number of events:              3056390
    total time taken by event execution: 600005.2104s
    response time:
         min:                                  9.57ms
         avg:                                196.31ms
         max:                                608.70ms
         approx.  95 percentile:             268.71ms

Threads fairness:
    events (avg/stddev):           3056.3900/67.44
    execution time (avg/stddev):   600.0052/0.01
संग्रहित मीट्रिक
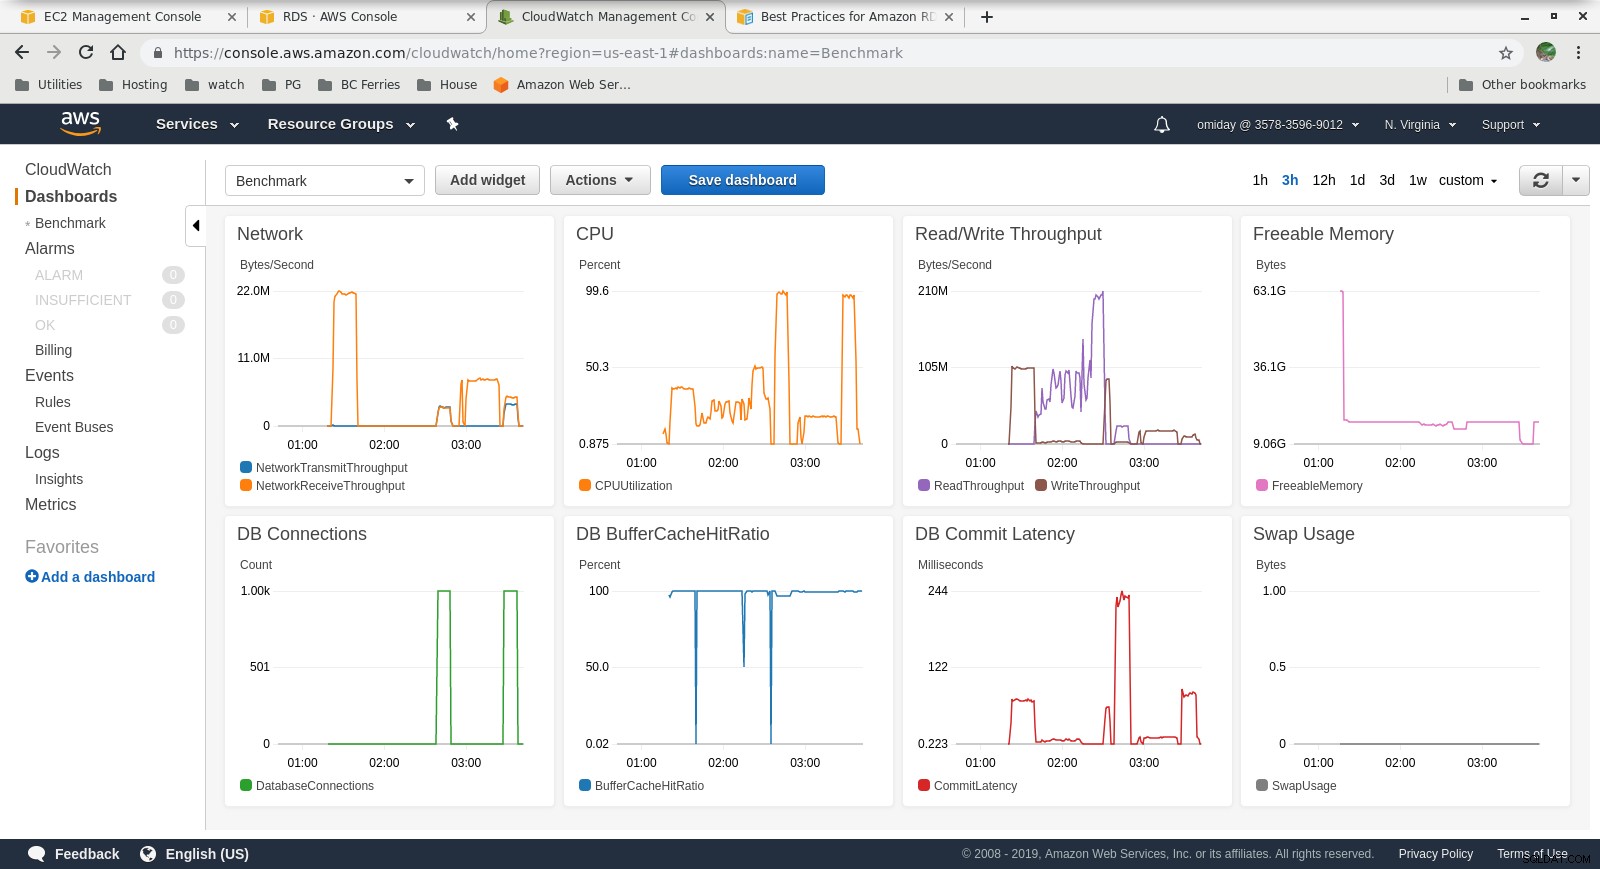 क्लाउडवॉच मेट्रिक्स
 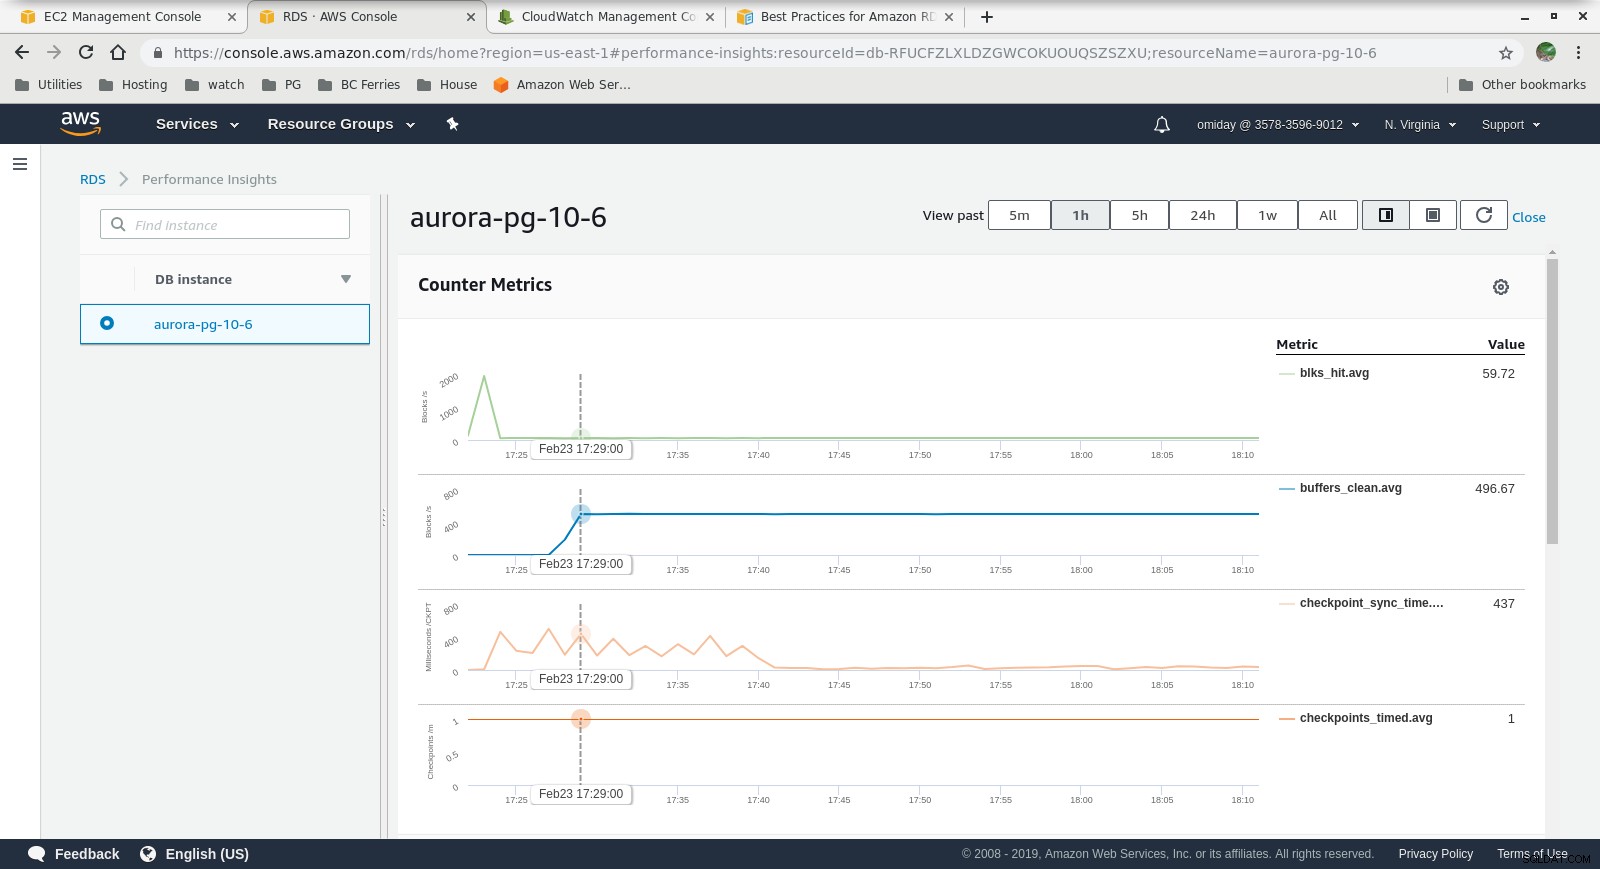 प्रदर्शन अंतर्दृष्टि - काउंटर मेट्रिक्स
 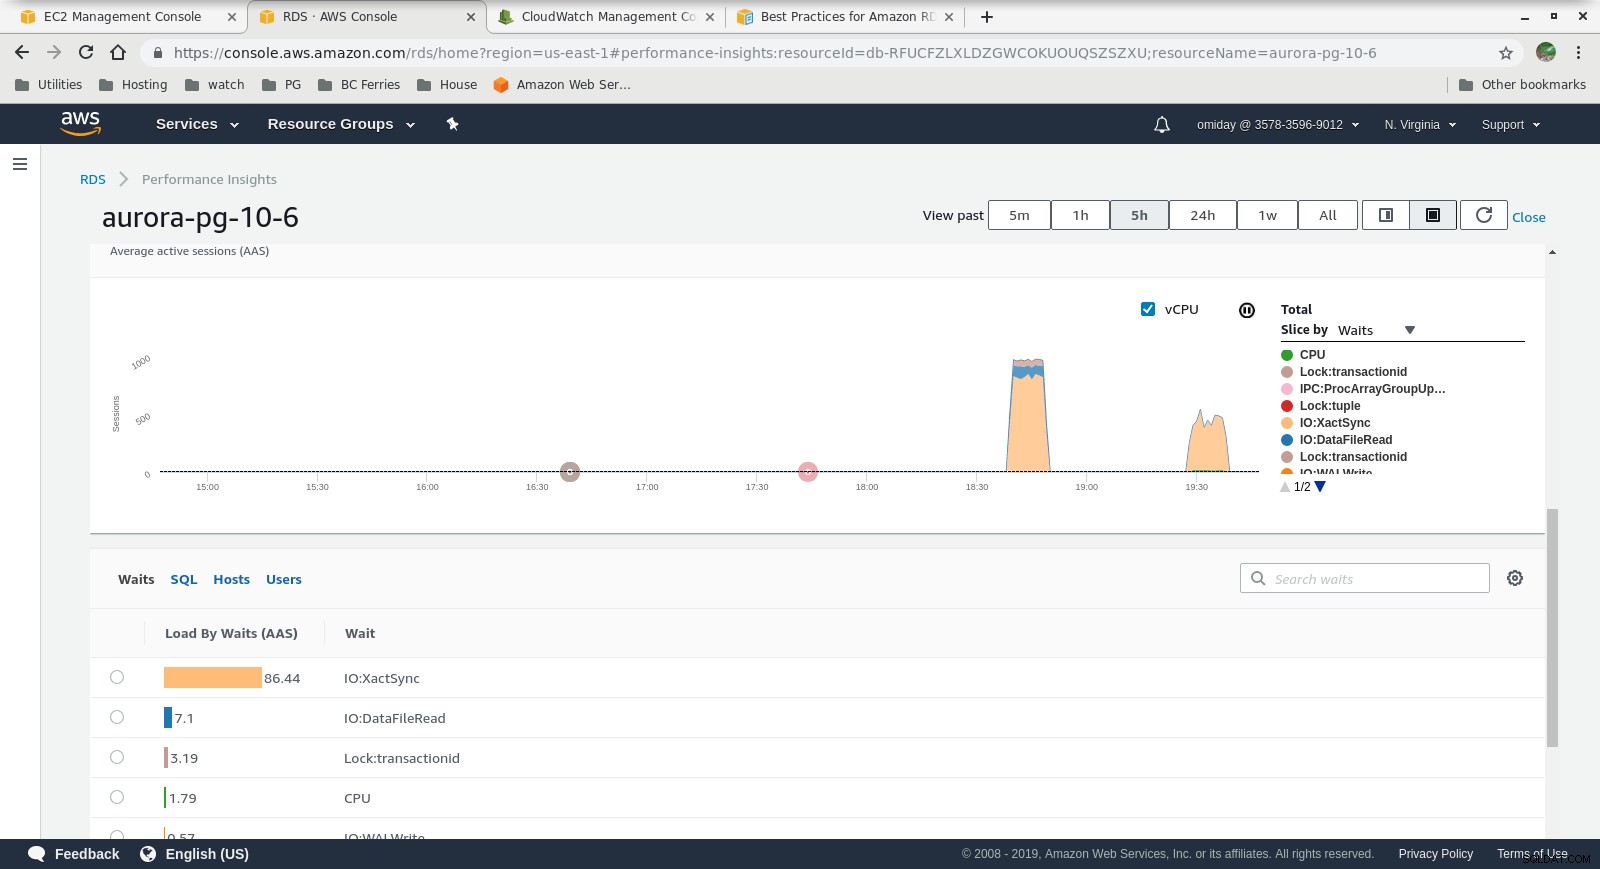 प्रदर्शन अंतर्दृष्टि - प्रतीक्षा द्वारा डेटाबेस लोड
 अंतिम विचार
- उपयोगकर्ता पूर्वनिर्धारित आवृत्ति आकारों का उपयोग करने तक सीमित हैं। एक नकारात्मक पहलू के रूप में, यदि बेंचमार्क दिखाता है कि इंस्टेंस अतिरिक्त मेमोरी से लाभान्वित हो सकता है, तो "बस अधिक रैम जोड़ना" संभव नहीं है। अधिक मेमोरी जोड़ने से इंस्टेंस आकार में वृद्धि होती है जो उच्च लागत के साथ आता है (प्रत्येक इंस्टेंस आकार के लिए लागत दोगुनी हो जाती है)।
- अमेज़ॅन ऑरोरा स्टोरेज इंजन आरडीएस से काफी अलग है, और इसे सैन हार्डवेयर के शीर्ष पर बनाया गया है। प्रति उदाहरण I/O थ्रूपुट मेट्रिक्स दिखाते हैं कि परीक्षण 1,750 MiB/s के प्रावधानित IOPS SSD EBS वॉल्यूम के लिए अधिकतम के करीब भी नहीं पहुंचा।
- प्रदर्शन अंतर्दृष्टि ग्राफ़ में शामिल AWS PostgreSQL ईवेंट की समीक्षा करके आगे की ट्यूनिंग की जा सकती है।
श्रृंखला में अगला
अगले भाग के लिए बने रहें:PostgreSQL 10.6 के लिए Amazon RDS।