परिचय
डेटाबेस तकनीक के बावजूद, समस्याओं का पता लगाने और कार्रवाई करने, या हमारे सिस्टम की वर्तमान स्थिति को जानने के लिए, दोनों के लिए एक निगरानी सेटअप होना आवश्यक है।
इस उद्देश्य के लिए कई उपकरण हैं, सशुल्क और निःशुल्क। इस ब्लॉग में हम विशेष रूप से एक पर ध्यान देंगे:नागियोस कोर।
नागिओस कोर क्या है?
Nagios Core होस्ट, नेटवर्क और सेवाओं की निगरानी के लिए एक ओपन सोर्स सिस्टम है। यह अलर्ट कॉन्फ़िगर करने की अनुमति देता है और उनके लिए अलग-अलग राज्य हैं। यह समुदाय द्वारा विकसित प्लगइन्स के कार्यान्वयन की अनुमति देता है, या यहां तक कि हमें अपनी निगरानी स्क्रिप्ट को कॉन्फ़िगर करने की भी अनुमति देता है।
नागिओस कैसे स्थापित करें?
आधिकारिक दस्तावेज हमें दिखाता है कि CentOS या Ubuntu सिस्टम पर Nagios Core कैसे स्थापित किया जाए।
आइए CentOS 7 पर इंस्टॉलेशन के लिए आवश्यक चरणों का एक उदाहरण देखें।
आवश्यक पैकेज
[example@sqldat.com ~]# yum install -y wget httpd php gcc glibc glibc-common gd gd-devel make net-snmp unzipनागियोस कोर, नागियोस प्लगइन्स और एनआरपीई डाउनलोड करें
[example@sqldat.com ~]# wget https://assets.nagios.com/downloads/nagioscore/releases/nagios-4.4.2.tar.gz
[example@sqldat.com ~]# wget https://nagios-plugins.org/download/nagios-plugins-2.2.1.tar.gz
[example@sqldat.com ~]# wget https://github.com/NagiosEnterprises/nrpe/releases/download/nrpe-3.2.1/nrpe-3.2.1.tar.gz
नागियोस उपयोगकर्ता और समूह जोड़ें
[example@sqldat.com ~]# useradd nagios
[example@sqldat.com ~]# groupadd nagcmd
[example@sqldat.com ~]# usermod -a -G nagcmd nagios
[example@sqldat.com ~]# usermod -a -G nagios,nagcmd apache
नागियोस इंस्टालेशन
[example@sqldat.com ~]# tar zxvf nagios-4.4.2.tar.gz
[example@sqldat.com ~]# cd nagios-4.4.2
[example@sqldat.com nagios-4.4.2]# ./configure --with-command-group=nagcmd
[example@sqldat.com nagios-4.4.2]# make all
[example@sqldat.com nagios-4.4.2]# make install
[example@sqldat.com nagios-4.4.2]# make install-init
[example@sqldat.com nagios-4.4.2]# make install-config
[example@sqldat.com nagios-4.4.2]# make install-commandmode
[example@sqldat.com nagios-4.4.2]# make install-webconf
[example@sqldat.com nagios-4.4.2]# cp -R contrib/eventhandlers/ /usr/local/nagios/libexec/
[example@sqldat.com nagios-4.4.2]# chown -R nagios:nagios /usr/local/nagios/libexec/eventhandlers
[example@sqldat.com nagios-4.4.2]# /usr/local/nagios/bin/nagios -v /usr/local/nagios/etc/nagios.cfg
नागियोस प्लगिन और एनआरपीई इंस्टालेशन
[example@sqldat.com ~]# tar zxvf nagios-plugins-2.2.1.tar.gz
[example@sqldat.com ~]# cd nagios-plugins-2.2.1
[example@sqldat.com nagios-plugins-2.2.1]# ./configure --with-nagios-user=nagios --with-nagios-group=nagios
[example@sqldat.com nagios-plugins-2.2.1]# make
[example@sqldat.com nagios-plugins-2.2.1]# make install
[example@sqldat.com ~]# yum install epel-release
[example@sqldat.com ~]# yum install nagios-plugins-nrpe
[example@sqldat.com ~]# tar zxvf nrpe-3.2.1.tar.gz
[example@sqldat.com ~]# cd nrpe-3.2.1
[example@sqldat.com nrpe-3.2.1]# ./configure --disable-ssl --enable-command-args
[example@sqldat.com nrpe-3.2.1]# make all
[example@sqldat.com nrpe-3.2.1]# make install-plugin
हम अपने सर्वर की जाँच करते समय NRPE का उपयोग करने के लिए अपनी फ़ाइल /usr/local/nagios/etc/objects/command.cfg के अंत में निम्नलिखित पंक्ति जोड़ते हैं:
define command{
    command_name           check_nrpe
    command_line           /usr/local/nagios/libexec/check_nrpe -H $HOSTADDRESS$ -c $ARG1$
}
नागियोस शुरू होता है
[example@sqldat.com nagios-4.4.2]# systemctl start nagios
[example@sqldat.com nagios-4.4.2]# systemctl start httpd
वेब पहुंच
हम वेब इंटरफेस तक पहुंचने के लिए उपयोगकर्ता बनाते हैं और हम साइट में प्रवेश कर सकते हैं।
[example@sqldat.com nagios-4.4.2]# htpasswd -c /usr/local/nagios/etc/htpasswd.users nagiosadminhttps://IP_Address/nagios/
 नागियोस वेब एक्सेस
 नागियोस को कैसे कॉन्फ़िगर करें?
अब जब हमने अपना नागियोस स्थापित कर लिया है, तो हम कॉन्फ़िगरेशन के साथ जारी रख सकते हैं। इसके लिए हमें अपने इंस्टालेशन के अनुरूप स्थान पर जाना होगा, हमारे उदाहरण में /usr/local/nagios/etc।
कई अलग-अलग कॉन्फ़िगरेशन फ़ाइलें हैं जिन्हें आपको किसी भी चीज़ की निगरानी शुरू करने से पहले बनाने या संपादित करने की आवश्यकता होगी।
[example@sqldat.com etc]# ls /usr/local/nagios/etc
cgi.cfg htpasswd.users nagios.cfg objects resource.cfg- cgi.cfg: CGI कॉन्फ़िगरेशन फ़ाइल में कई निर्देश होते हैं जो CGI के संचालन को प्रभावित करते हैं। इसमें मुख्य कॉन्फ़िगरेशन फ़ाइल का संदर्भ भी शामिल है, इसलिए CGI को पता है कि आपने Nagios को कैसे कॉन्फ़िगर किया है और आपकी ऑब्जेक्ट परिभाषाएँ कहाँ संग्रहीत हैं।
- htpasswd.users: इस फ़ाइल में Nagios वेब इंटरफ़ेस तक पहुँचने के लिए बनाए गए उपयोगकर्ता शामिल हैं।
- nagios.cfg: मुख्य कॉन्फ़िगरेशन फ़ाइल में कई निर्देश होते हैं जो नागियोस कोर डेमॉन के संचालन को प्रभावित करते हैं।
- वस्तुएं: जब आप नागियोस स्थापित करते हैं, तो कई नमूना ऑब्जेक्ट कॉन्फ़िगरेशन फ़ाइलें यहां रखी जाती हैं। आप इन नमूना फ़ाइलों का उपयोग यह देखने के लिए कर सकते हैं कि ऑब्जेक्ट इनहेरिटेंस कैसे काम करता है, और अपनी खुद की ऑब्जेक्ट परिभाषाओं को परिभाषित करना सीखें। ऑब्जेक्ट वे सभी तत्व हैं जो निगरानी और अधिसूचना तर्क में शामिल हैं।
- resource.cfg: इसका उपयोग एक वैकल्पिक संसाधन फ़ाइल को निर्दिष्ट करने के लिए किया जाता है जिसमें मैक्रो परिभाषाएँ हो सकती हैं। मैक्रोज़ आपको अपने आदेशों में मेजबानों, सेवाओं और अन्य स्रोतों की जानकारी का संदर्भ देने की अनुमति देते हैं।
वस्तुओं के भीतर, हम टेम्पलेट पा सकते हैं, जिनका उपयोग नई वस्तुओं को बनाते समय किया जा सकता है। उदाहरण के लिए, हम देख सकते हैं कि हमारी फ़ाइल /usr/local/nagios/etc/objects/templates.cfg में, linux-server नामक एक टेम्प्लेट है, जिसका उपयोग हमारे सर्वर को जोड़ने के लिए किया जाएगा।
define host {
    name                            linux-server            ; The name of this host template
    use                             generic-host            ; This template inherits other values from the generic-host template
    check_period                    24x7                    ; By default, Linux hosts are checked round the clock
    check_interval                  5                       ; Actively check the host every 5 minutes
    retry_interval                  1                       ; Schedule host check retries at 1 minute intervals
    max_check_attempts              10                      ; Check each Linux host 10 times (max)
    check_command                   check-host-alive        ; Default command to check Linux hosts
    notification_period             workhours               ; Linux admins hate to be woken up, so we only notify during the day
                                                           ; Note that the notification_period variable is being overridden from
                                                           ; the value that is inherited from the generic-host template!
    notification_interval           120                     ; Resend notifications every 2 hours
    notification_options            d,u,r                   ; Only send notifications for specific host states
    contact_groups                  admins                  ; Notifications get sent to the admins by default
    register                        0                       ; DON'T REGISTER THIS DEFINITION - ITS NOT A REAL HOST, JUST A TEMPLATE!
}
इस टेम्पलेट का उपयोग करते हुए, हमारे होस्ट हमारे द्वारा जोड़े गए प्रत्येक सर्वर पर एक-एक करके उन्हें निर्दिष्ट किए बिना कॉन्फ़िगरेशन को इनहेरिट करेंगे।
हमारे पास पूर्वनिर्धारित आदेश, संपर्क और समय-अवधि भी हैं।
कमांड का उपयोग नागियोस द्वारा इसकी जाँच के लिए किया जाएगा, और इसे हम मॉनिटर करने के लिए प्रत्येक सर्वर की कॉन्फ़िगरेशन फ़ाइल में जोड़ते हैं। उदाहरण के लिए, पिंग:
define command {
    command_name    check_ping
    command_line    $USER1$/check_ping -H $HOSTADDRESS$ -w $ARG1$ -c $ARG2$ -p 5
}
हमारे पास संपर्क या समूह बनाने और यह निर्दिष्ट करने की संभावना है कि मैं किस व्यक्ति या समूह तक पहुंचना चाहता हूं।
define contact {
    contact_name            nagiosadmin             ; Short name of user
    use                     generic-contact         ; Inherit default values from generic-contact template (defined above)
    alias                   Nagios Admin            ; Full name of user
    email                   example@sqldat.com ; <<***** CHANGE THIS TO YOUR EMAIL ADDRESS ******
}
हमारे चेक और अलर्ट के लिए, हम कॉन्फ़िगर कर सकते हैं कि हम उन्हें किन घंटों और दिनों में प्राप्त करना चाहते हैं। अगर हमारे पास ऐसी सेवा है जो महत्वपूर्ण नहीं है, तो शायद हम सुबह उठना नहीं चाहते हैं, इसलिए इससे बचने के लिए केवल काम के घंटों में सतर्क रहना अच्छा होगा।
define timeperiod {
    name                    workhours
    timeperiod_name         workhours
    alias                   Normal Work Hours
    monday                  09:00-17:00
    tuesday                 09:00-17:00
    wednesday               09:00-17:00
    thursday                09:00-17:00
    friday                  09:00-17:00
}
आइए अब देखें कि हमारे Nagios में अलर्ट कैसे जोड़ें।
हम अपने PostgreSQL सर्वर की निगरानी करने जा रहे हैं, इसलिए हम पहले उन्हें अपने ऑब्जेक्ट डायरेक्टरी में होस्ट के रूप में जोड़ते हैं। हम 3 नई फाइलें बनाएंगे:
[example@sqldat.com ~]# cd /usr/local/nagios/etc/objects/
[example@sqldat.com objects]# vi postgres1.cfg
define host {
    use        linux-server      ; Name of host template to use
    host_name    postgres1        ; Hostname
    alias        PostgreSQL1        ; Alias
    address    192.168.100.123    ; IP Address
}
[example@sqldat.com objects]# vi postgres2.cfg
define host {
    use        linux-server      ; Name of host template to use
    host_name    postgres2        ; Hostname
    alias        PostgreSQL2        ; Alias
    address    192.168.100.124    ; IP Address
}
[example@sqldat.com objects]# vi postgres3.cfg
define host {
    use        linux-server      ; Name of host template to use
    host_name    postgres3        ; Hostname
    alias        PostgreSQL3        ; Alias
    address    192.168.100.125    ; IP Address
}
फिर हमें उन्हें फ़ाइल nagios.cfg में जोड़ना होगा और यहाँ हमारे पास 2 विकल्प हैं।
cfg_file चर (डिफ़ॉल्ट विकल्प) का उपयोग करके एक-एक करके हमारे होस्ट (cfg फ़ाइलें) जोड़ें या cfg_dir चर का उपयोग करके एक निर्देशिका के अंदर हमारे पास मौजूद सभी cfg फ़ाइलें जोड़ें।
हम डिफ़ॉल्ट रणनीति का पालन करते हुए एक-एक करके फ़ाइलें जोड़ेंगे।
cfg_file=/usr/local/nagios/etc/objects/postgres1.cfg
cfg_file=/usr/local/nagios/etc/objects/postgres2.cfg
cfg_file=/usr/local/nagios/etc/objects/postgres3.cfg
इससे हमारे मेजबानों पर नजर रखी जाती है। अब हमें बस यह जोड़ना है कि हम किन सेवाओं की निगरानी करना चाहते हैं। इसके लिए हम कुछ पहले से परिभाषित चेक (चेक_एसएसएच और चेक_पिंग) का उपयोग करेंगे, और हम एनआरपीई का उपयोग करके ऑपरेटिंग सिस्टम के कुछ बुनियादी चेक जैसे लोड और डिस्क स्पेस, अन्य के साथ जोड़ देंगे।
आज श्वेतपत्र डाउनलोड करें क्लस्टरकंट्रोल के साथ पोस्टग्रेएसक्यूएल प्रबंधन और स्वचालन इस बारे में जानें कि पोस्टग्रेएसक्यूएल को तैनात करने, मॉनिटर करने, प्रबंधित करने और स्केल करने के लिए आपको क्या जानना चाहिए। श्वेतपत्र डाउनलोड करेंNRPE क्या है?
नागियोस रिमोट प्लगइन एक्ज़ीक्यूटर। यह उपकरण हमें दूरस्थ होस्ट पर यथासंभव पारदर्शी तरीके से Nagios प्लगइन्स को निष्पादित करने की अनुमति देता है।
इसका उपयोग करने के लिए, हमें प्रत्येक नोड में सर्वर स्थापित करना होगा जिसे हम मॉनिटर करना चाहते हैं, और हमारे Nagios संबंधित प्लगइन को निष्पादित करते हुए, उनमें से प्रत्येक के लिए एक क्लाइंट के रूप में कनेक्ट होंगे।
NRPE कैसे स्थापित करें?
[example@sqldat.com ~]# wget https://github.com/NagiosEnterprises/nrpe/releases/download/nrpe-3.2.1/nrpe-3.2.1.tar.gz
[example@sqldat.com ~]# wget https://nagios-plugins.org/download/nagios-plugins-2.2.1.tar.gz
[example@sqldat.com ~]# tar zxvf nagios-plugins-2.2.1.tar.gz
[example@sqldat.com ~]# tar zxvf nrpe-3.2.1.tar.gz
[example@sqldat.com ~]# cd nrpe-3.2.1
[example@sqldat.com nrpe-3.2.1]# ./configure --disable-ssl --enable-command-args
[example@sqldat.com nrpe-3.2.1]# make all
[example@sqldat.com nrpe-3.2.1]# make install-groups-users
[example@sqldat.com nrpe-3.2.1]# make install
[example@sqldat.com nrpe-3.2.1]# make install-config
[example@sqldat.com nrpe-3.2.1]# make install-init
[example@sqldat.com ~]# cd nagios-plugins-2.2.1
[example@sqldat.com nagios-plugins-2.2.1]# ./configure --with-nagios-user=nagios --with-nagios-group=nagios
[example@sqldat.com nagios-plugins-2.2.1]# make
[example@sqldat.com nagios-plugins-2.2.1]# make install
[example@sqldat.com nagios-plugins-2.2.1]# systemctl enable nrpe
फिर हम कॉन्फ़िगरेशन फ़ाइल /usr/local/nagios/etc/nrpe.cfg
को संपादित करते हैंserver_address=<Local IP Address>
allowed_hosts=127.0.0.1,<Nagios Server IP Address>और हम एनआरपीई सेवा को फिर से शुरू करते हैं:
[example@sqldat.com ~]# systemctl restart nrpeहम अपने Nagios सर्वर से निम्नलिखित को चलाकर कनेक्शन का परीक्षण कर सकते हैं:
[example@sqldat.com ~]# /usr/local/nagios/libexec/check_nrpe -H <Node IP Address>
NRPE v3.2.1
PostgreSQL की निगरानी कैसे करें?
PostgreSQL की निगरानी करते समय, दो मुख्य क्षेत्रों को ध्यान में रखना चाहिए:ऑपरेटिंग सिस्टम और डेटाबेस।
ऑपरेटिंग सिस्टम के लिए, NRPE में कुछ बुनियादी चेक कॉन्फ़िगर किए गए हैं जैसे कि डिस्क स्थान और लोड, दूसरों के बीच में। इन चेकों को निम्नलिखित तरीके से बहुत आसानी से सक्षम किया जा सकता है।
हमारे नोड्स में हम फ़ाइल /usr/local/nagios/etc/nrpe.cfg को संपादित करते हैं और वहां जाते हैं जहां निम्नलिखित पंक्तियां हैं:
command[check_users]=/usr/local/nagios/libexec/check_users -w 5 -c 10
command[check_load]=/usr/local/nagios/libexec/check_load -r -w 15,10,05 -c 30,25,20
command[check_disk]=/usr/local/nagios/libexec/check_disk -w 20% -c 10% -p /
command[check_zombie_procs]=/usr/local/nagios/libexec/check_procs -w 5 -c 10 -s Z
command[check_total_procs]=/usr/local/nagios/libexec/check_procs -w 150 -c 200
वर्गाकार कोष्ठकों में वे नाम हैं जिनका उपयोग हम इन जाँचों को सक्षम करने के लिए अपने Nagios सर्वर में करेंगे।
हमारे Nagios में, हम 3 नोड्स की फाइलों को संपादित करते हैं:
/usr/local/nagios/etc/objects/postgres1.cfg
/usr/local/nagios/etc/objects/postgres2.cfg
/usr/local/nagios/etc/objects/postgres3.cfg
हम इन चेकों को जोड़ते हैं जिन्हें हमने पहले देखा था, हमारी फाइलों को इस प्रकार छोड़ते हुए:
define host {
    use                     linux-server
    host_name               postgres1
    alias                   PostgreSQL1
    address                 192.168.100.123
}
define service {
    use                     generic-service
    host_name               postgres1
    service_description     PING
    check_command           check_ping!100.0,20%!500.0,60%
}
define service {
    use                     generic-service
    host_name               postgres1
    service_description     SSH
    check_command           check_ssh
}
define service {
    use                     generic-service
    host_name               postgres1
    service_description     Root Partition
    check_command        check_nrpe!check_disk
}
define service {
    use                     generic-service
    host_name               postgres1
    service_description     Total Processes zombie
    check_command           check_nrpe!check_zombie_procs
}
define service {
    use                     generic-service
    host_name               postgres1
    service_description     Total Processes
    check_command           check_nrpe!check_total_procs
}
define service {
    use                     generic-service
    host_name               postgres1
    service_description     Current Load
    check_command           check_nrpe!check_load
}
define service {
    use                     generic-service
    host_name               postgres1
    service_description     Current Users
    check_command           check_nrpe!check_users
}
और हम nagios सेवा को फिर से शुरू करते हैं:
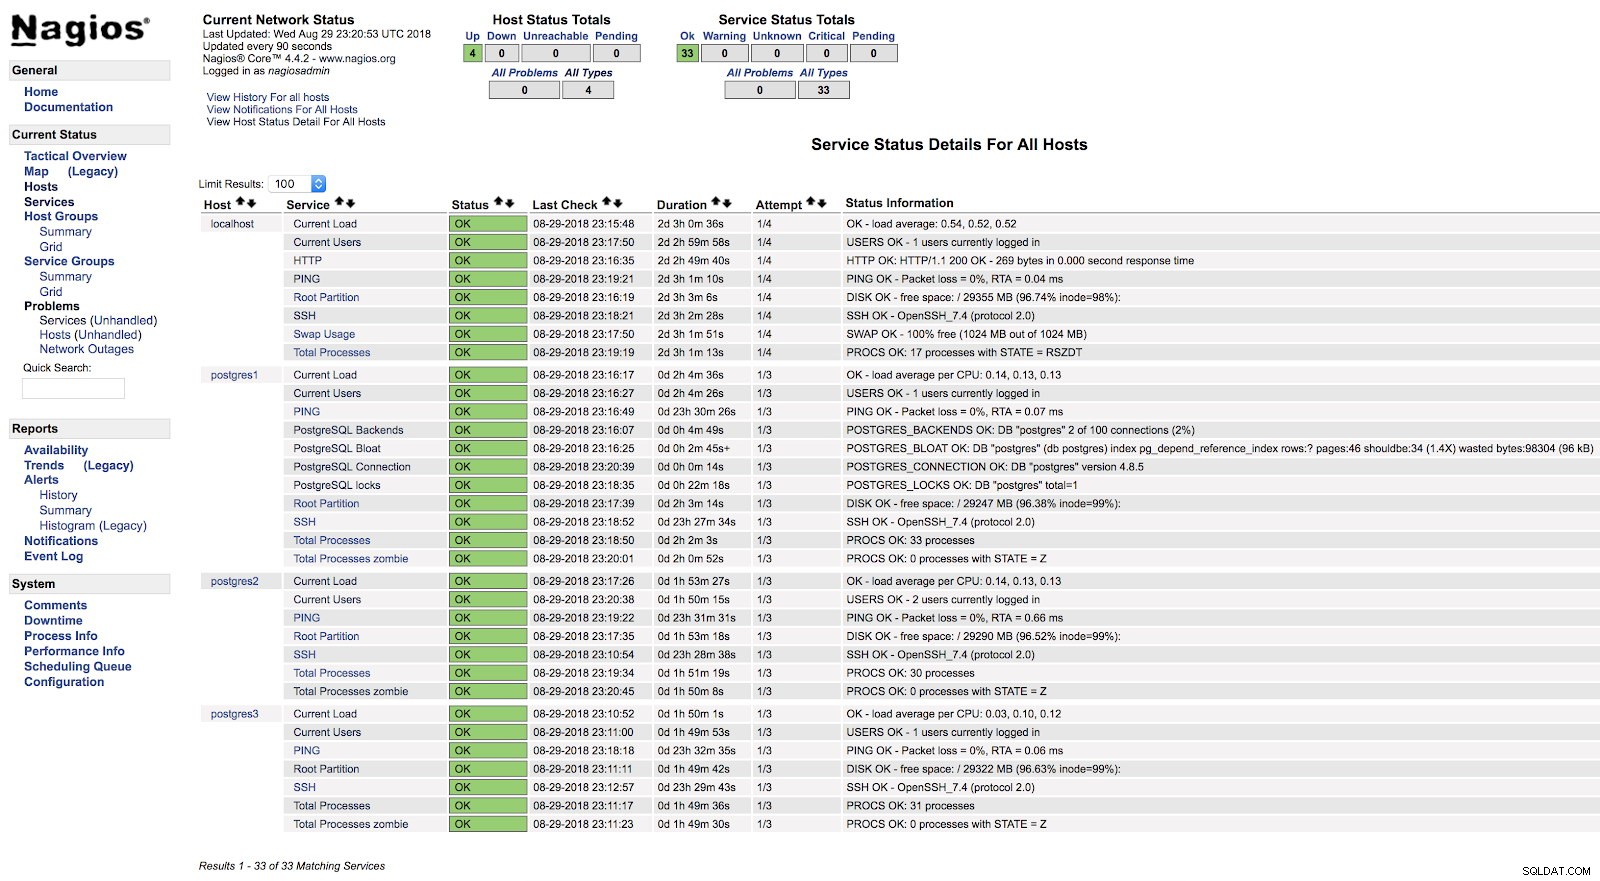
[example@sqldat.com ~]# systemctl start nagiosइस बिंदु पर, यदि हम अपने Nagios के वेब इंटरफ़ेस में सेवा अनुभाग में जाते हैं, तो हमारे पास निम्न जैसा कुछ होना चाहिए:
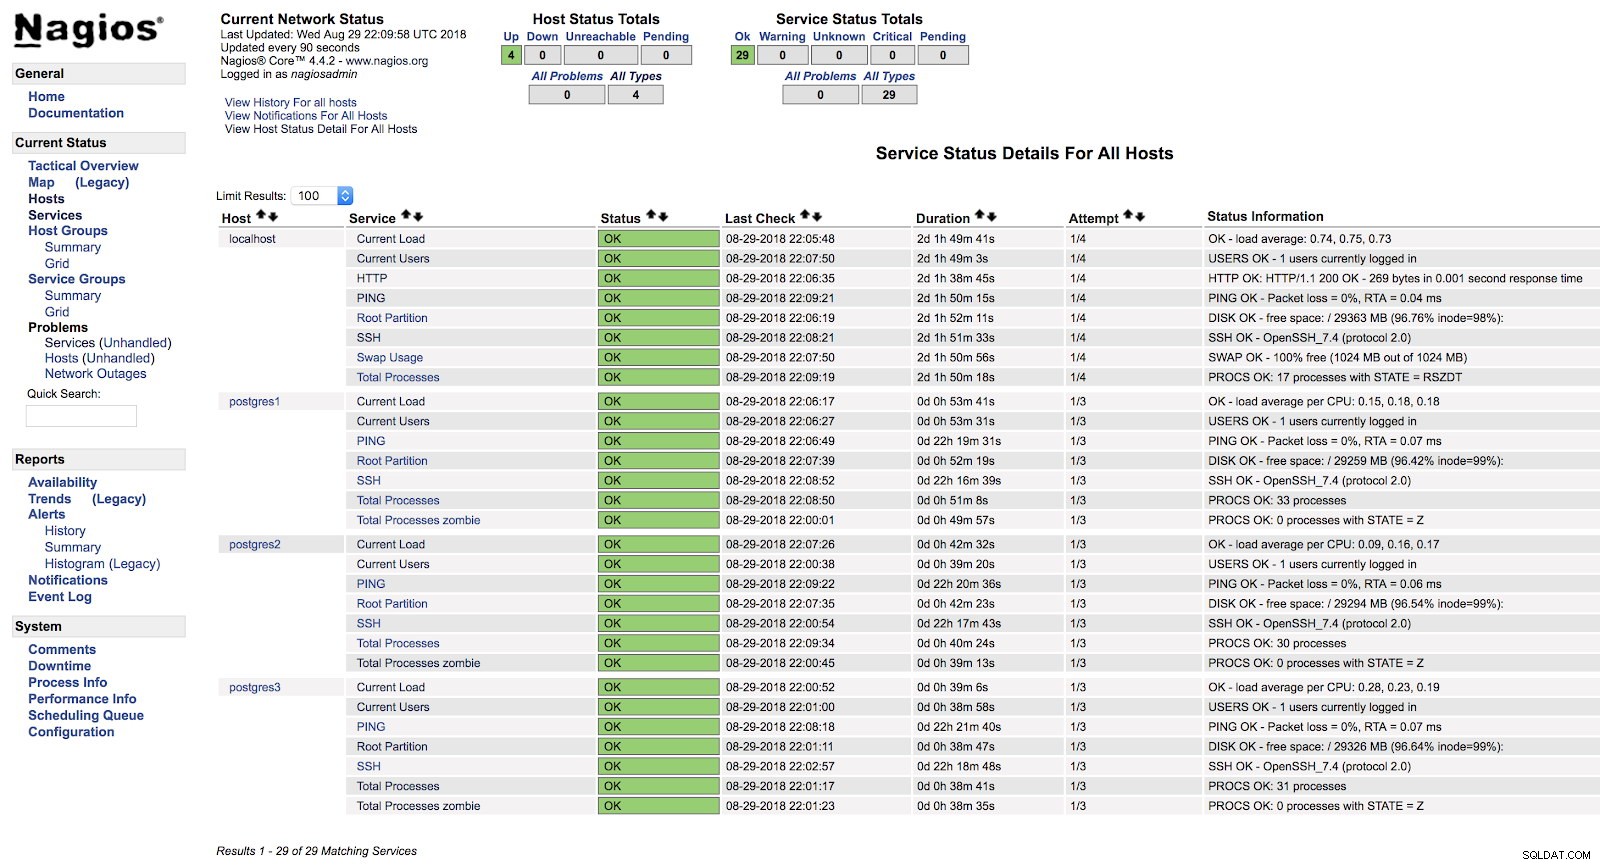 नागियोस होस्ट अलर्ट
 इस तरह हम ऑपरेटिंग सिस्टम स्तर पर अपने सर्वर की बुनियादी जांच को कवर करेंगे।
हमारे पास और भी कई चेक हैं जिन्हें हम जोड़ सकते हैं और हम अपने स्वयं के चेक भी बना सकते हैं (हम एक उदाहरण बाद में देखेंगे)।
अब देखते हैं कि इस कार्य के लिए डिज़ाइन किए गए दो मुख्य प्लग इन का उपयोग करके हमारे PostgreSQL डेटाबेस इंजन की निगरानी कैसे करें।
चेक_पोस्टग्रेज
PostgreSQL की जाँच के लिए सबसे लोकप्रिय प्लगइन्स में से एक Bucardo से check_postgres है।
आइए देखें कि इसे कैसे स्थापित करें और हमारे PostgreSQL डेटाबेस के साथ इसका उपयोग कैसे करें।
आवश्यक पैकेज
[example@sqldat.com ~]# yum install perl-develस्थापना
[example@sqldat.com ~]#  wget https://bucardo.org/downloads/check_postgres.tar.gz
[example@sqldat.com ~]#  tar zxvf check_postgres.tar.gz
[example@sqldat.com ~]#  cp check_postgres-2.23.0/check_postgres.pl /usr/local/nagios/libexec/
[example@sqldat.com ~]# chown nagios.nagios /usr/local/nagios/libexec/check_postgres.pl
[example@sqldat.com ~]# cd /usr/local/nagios/libexec/
[example@sqldat.com libexec]# perl /usr/local/nagios/libexec/check_postgres.pl  --symlinks
यह अंतिम आदेश इस चेक के सभी कार्यों का उपयोग करने के लिए लिंक बनाता है, जैसे check_postgres_connection, check_postgres_last_vacuum या check_postgres_replication_slots दूसरों के बीच।
[example@sqldat.com libexec]# ls |grep postgres
check_postgres.pl
check_postgres_archive_ready
check_postgres_autovac_freeze
check_postgres_backends
check_postgres_bloat
check_postgres_checkpoint
check_postgres_cluster_id
check_postgres_commitratio
check_postgres_connection
check_postgres_custom_query
check_postgres_database_size
check_postgres_dbstats
check_postgres_disabled_triggers
check_postgres_disk_space
…
हम अपनी NRPE कॉन्फ़िगरेशन फ़ाइल (/usr/local/nagios/etc/nrpe.cfg) में उस चेक को निष्पादित करने के लिए लाइन जोड़ते हैं जिसका हम उपयोग करना चाहते हैं:
command[check_postgres_locks]=/usr/local/nagios/libexec/check_postgres_locks -w 2 -c 3
command[check_postgres_bloat]=/usr/local/nagios/libexec/check_postgres_bloat -w='100 M' -c='200 M'
command[check_postgres_connection]=/usr/local/nagios/libexec/check_postgres_connection --db=postgres
command[check_postgres_backends]=/usr/local/nagios/libexec/check_postgres_backends -w=70 -c=100
हमारे उदाहरण में हमने PostgreSQL के लिए 4 बुनियादी जाँचें जोड़ीं। हम ताले, ब्लोट, कनेक्शन और बैकएंड की निगरानी करेंगे।
Nagios सर्वर (/usr/local/nagios/etc/objects/postgres1.cfg) में हमारे डेटाबेस से संबंधित फ़ाइल में, हम निम्नलिखित प्रविष्टियाँ जोड़ते हैं:
define service {
use generic-service
host_name postgres1
service_description PostgreSQL locks
check_command check_nrpe!check_postgres_locks
}
define service {
use generic-service
host_name postgres1
service_description PostgreSQL Bloat
check_command check_nrpe!check_postgres_bloat
}
define service {
use generic-service
host_name postgres1
service_description PostgreSQL Connection
check_command check_nrpe!check_postgres_connection
}
define service {
use generic-service
host_name postgres1
service_description PostgreSQL Backends
check_command check_nrpe!check_postgres_backends
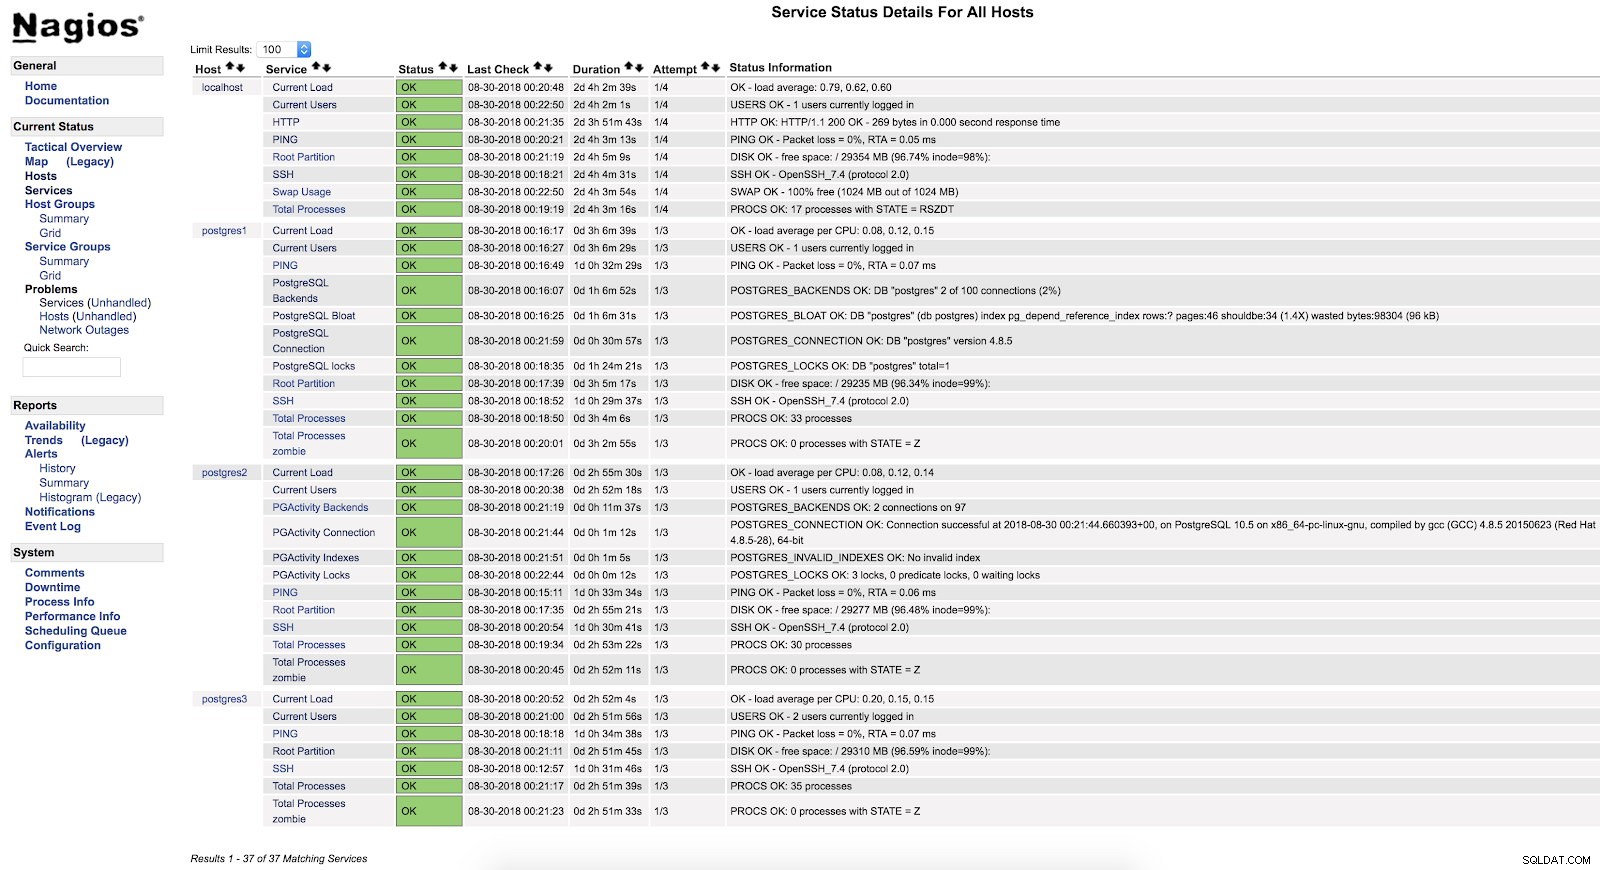
}और दोनों सर्वरों पर दोनों सेवाओं (NRPE और Nagios) को पुनरारंभ करने के बाद, हम अपने अलर्ट कॉन्फ़िगर किए गए देख सकते हैं।
 Nagios check_postgres अलर्ट
 check_postgres प्लगइन के आधिकारिक दस्तावेज़ीकरण में, आप इस बारे में जानकारी प्राप्त कर सकते हैं कि और क्या मॉनिटर करना है और इसे कैसे करना है।
चेक_पीजीएक्टिविटी
अब check_pgactivity की बारी है, जो हमारे PostgreSQL डेटाबेस की निगरानी के लिए भी लोकप्रिय है।
इंस्टॉलेशन
[example@sqldat.com ~]# wget https://github.com/OPMDG/check_pgactivity/releases/download/REL2_3/check_pgactivity-2.3.tgz
[example@sqldat.com ~]# tar zxvf check_pgactivity-2.3.tgz
[example@sqldat.com ~]# cp check_pgactivity-2.3check_pgactivity /usr/local/nagios/libexec/check_pgactivity
[example@sqldat.com ~]# chown nagios.nagios /usr/local/nagios/libexec/check_pgactivity
हम अपनी NRPE कॉन्फ़िगरेशन फ़ाइल (/usr/local/nagios/etc/nrpe.cfg) में उस चेक को निष्पादित करने के लिए लाइन जोड़ते हैं जिसका हम उपयोग करना चाहते हैं:
command[check_pgactivity_backends]=/usr/local/nagios/libexec/check_pgactivity -h localhost -s backends -w 70 -c 100
command[check_pgactivity_connection]=/usr/local/nagios/libexec/check_pgactivity -h localhost -s connection
command[check_pgactivity_indexes]=/usr/local/nagios/libexec/check_pgactivity -h localhost -s invalid_indexes
command[check_pgactivity_locks]=/usr/local/nagios/libexec/check_pgactivity -h localhost -s locks -w 5 -c 10
हमारे उदाहरण में हम PostgreSQL के लिए 4 बुनियादी जांच जोड़ेंगे। हम बैकएंड, कनेक्शन, अमान्य इंडेक्स और लॉक की निगरानी करेंगे।
Nagios सर्वर (/usr/local/nagios/etc/objects/postgres2.cfg) में हमारे डेटाबेस से संबंधित फ़ाइल में, हम निम्नलिखित प्रविष्टियाँ जोड़ते हैं:
define service {
    use                     generic-service           ; Name of service template to use
    host_name               postgres2
    service_description     PGActivity Backends
    check_command           check_nrpe!check_pgactivity_backends
}
define service {
    use                     generic-service           ; Name of service template to use
    host_name               postgres2
    service_description     PGActivity Connection
    check_command           check_nrpe!check_pgactivity_connection
}
define service {
    use                     generic-service           ; Name of service template to use
    host_name               postgres2
    service_description     PGActivity Indexes
    check_command           check_nrpe!check_pgactivity_indexes
}
define service {
    use                     generic-service           ; Name of service template to use
    host_name               postgres2
    service_description     PGActivity Locks
    check_command           check_nrpe!check_pgactivity_locks
}
और दोनों सर्वरों पर दोनों सेवाओं (NRPE और Nagios) को पुनरारंभ करने के बाद, हम अपने अलर्ट कॉन्फ़िगर किए गए देख सकते हैं।
 नागियोस चेक_पीजीएक्टिविटी अलर्ट
 त्रुटि लॉग जांचें
सबसे महत्वपूर्ण जाँचों में से एक, या सबसे महत्वपूर्ण जाँच हमारे त्रुटि लॉग की जाँच करना है।
यहां हम विभिन्न प्रकार की त्रुटियां जैसे FATAL या गतिरोध पा सकते हैं, और हमारे डेटाबेस में किसी भी समस्या का विश्लेषण करने के लिए यह एक अच्छा प्रारंभिक बिंदु है।
अपने त्रुटि लॉग की जाँच करने के लिए, हम अपनी स्वयं की निगरानी स्क्रिप्ट बनाएंगे और इसे अपने Nagios में एकीकृत करेंगे (यह केवल एक उदाहरण है, यह स्क्रिप्ट बुनियादी होगी और इसमें सुधार की बहुत गुंजाइश है)।
स्क्रिप्ट
हम अपने PostgreSQL3 सर्वर पर फ़ाइल /usr/local/nagios/libexec/check_postgres_log.sh बनाएंगे।
[example@sqldat.com ~]# vi /usr/local/nagios/libexec/check_postgres_log.sh
#!/bin/bash
#Variables
LOG="/var/log/postgresql-$(date +%a).log"
CURRENT_DATE=$(date +'%Y-%m-%d %H')
ERROR=$(grep "$CURRENT_DATE" $LOG | grep "FATAL" | wc -l)
#States
STATE_CRITICAL=2
STATE_OK=0
#Check
if [ $ERROR -ne 0 ]; then
       echo "CRITICAL - Check PostgreSQL Log File - $ERROR Error Found"
       exit $STATE_CRITICAL
else
       echo "OK - PostgreSQL without errors"
       exit $STATE_OK
fi
स्क्रिप्ट की महत्वपूर्ण बात यह है कि प्रत्येक राज्य के अनुरूप आउटपुट को सही ढंग से बनाया जाए। ये आउटपुट Nagios द्वारा पढ़े जाते हैं और प्रत्येक संख्या एक राज्य से मेल खाती है:
0=OK
1=WARNING
2=CRITICAL
3=UNKNOWN
हमारे उदाहरण में हम केवल 2 राज्यों का उपयोग करेंगे, OK और CRITICAL, क्योंकि हम केवल यह जानने में रुचि रखते हैं कि क्या वर्तमान घंटे में हमारे त्रुटि लॉग में FATAL प्रकार की त्रुटियां हैं।
हमारे बाहर निकलने से पहले हम जिस पाठ का उपयोग करते हैं, वह हमारे Nagios के वेब इंटरफ़ेस द्वारा दिखाया जाएगा, इसलिए समस्या के लिए एक गाइड के रूप में इसका उपयोग करना जितना संभव हो उतना स्पष्ट होना चाहिए।
एक बार जब हम अपनी निगरानी स्क्रिप्ट समाप्त कर लेते हैं, तो हम इसे निष्पादन की अनुमति देने के लिए आगे बढ़ेंगे, इसे उपयोगकर्ता nagios को सौंपेंगे और इसे अपने डेटाबेस सर्वर NRPE के साथ-साथ हमारे Nagios में भी जोड़ेंगे:
[example@sqldat.com ~]# chmod +x /usr/local/nagios/libexec/check_postgres_log.sh
[example@sqldat.com ~]# chown nagios.nagios /usr/local/nagios/libexec/check_postgres_log.sh

[example@sqldat.com ~]# vi /usr/local/nagios/etc/nrpe.cfg
command[check_postgres_log]=/usr/local/nagios/libexec/check_postgres_log.sh

[example@sqldat.com ~]# vi /usr/local/nagios/etc/objects/postgres3.cfg
define service {
    use                     generic-service           ; Name of service template to use
    host_name               postgres3
    service_description     PostgreSQL LOG
    check_command           check_nrpe!check_postgres_log
}
NRPE और Nagios को पुनरारंभ करें। तब हम नागियोस इंटरफ़ेस में अपना चेक देख सकते हैं:
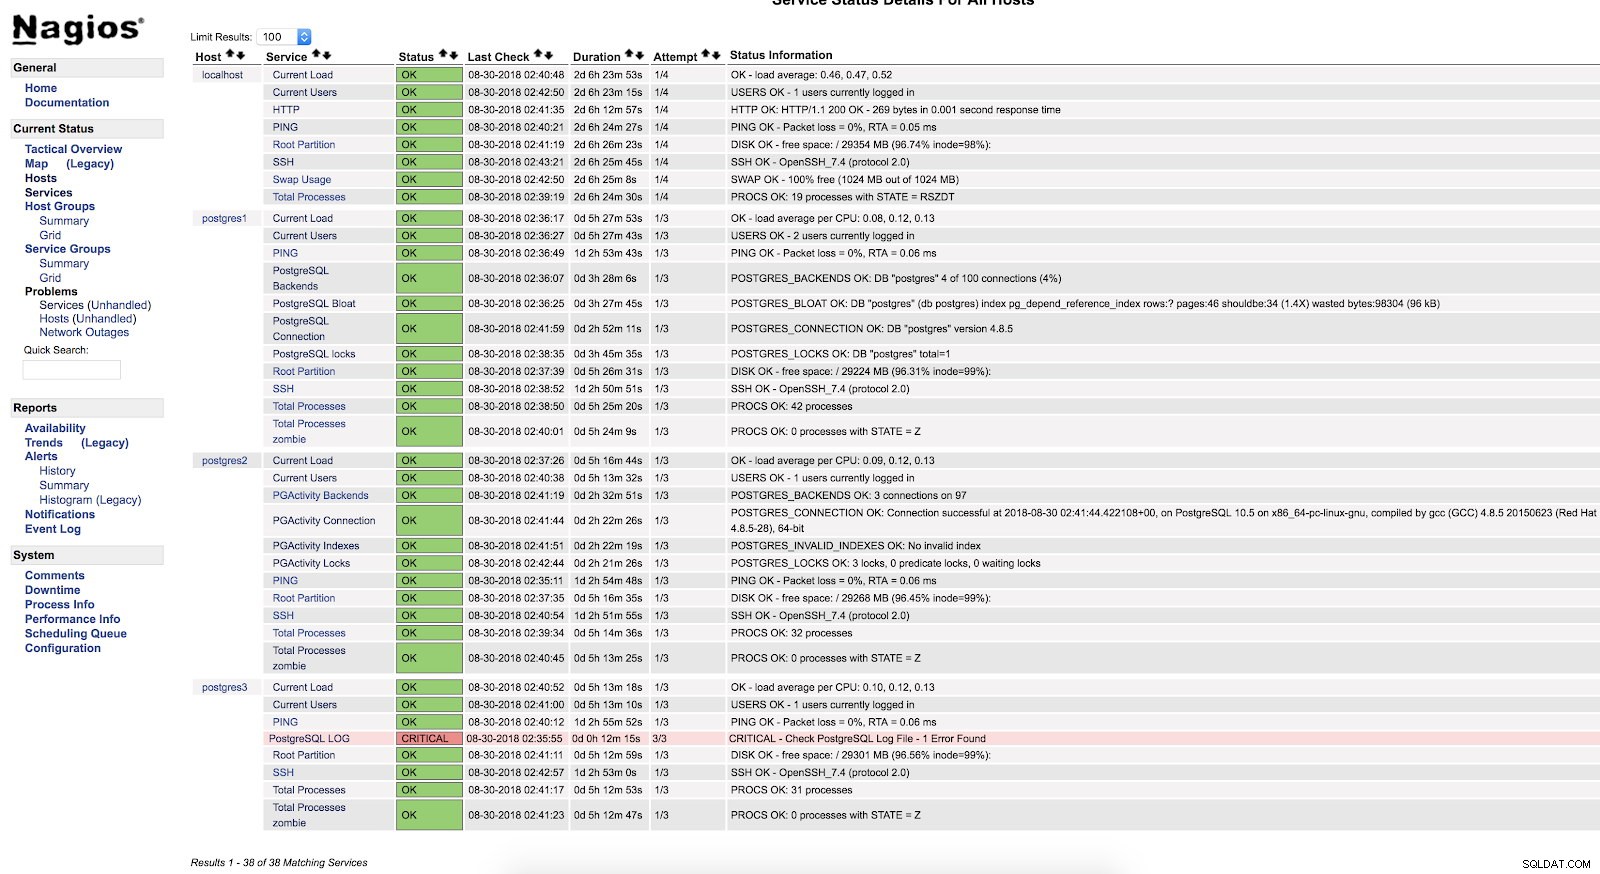 नागियोस स्क्रिप्ट अलर्ट
 जैसा कि हम देख सकते हैं कि यह एक गंभीर स्थिति में है, इसलिए यदि हम लॉग में जाते हैं, तो हम निम्नलिखित देख सकते हैं:
2018-08-30 02:29:49.531 UTC [22162] FATAL:  Peer authentication failed for user "postgres"
2018-08-30 02:29:49.531 UTC [22162] DETAIL:  Connection matched pg_hba.conf line 83: "local   all             all                                     peer"
हम अपने पोस्टग्रेएसक्यूएल डेटाबेस में क्या निगरानी कर सकते हैं, इस बारे में अधिक जानकारी के लिए, मैं आपको हमारे प्रदर्शन और निगरानी ब्लॉग या इस पोस्टग्रेज़ प्रदर्शन वेबिनार की जाँच करने की सलाह देता हूँ।
सुरक्षा और प्रदर्शन
किसी भी मॉनिटरिंग को कॉन्फ़िगर करते समय, या तो प्लगइन्स या हमारी अपनी स्क्रिप्ट का उपयोग करते हुए, हमें 2 बहुत महत्वपूर्ण चीजों - सुरक्षा और प्रदर्शन के साथ बहुत सावधान रहना चाहिए।
जब हम निगरानी के लिए आवश्यक अनुमतियां प्रदान करते हैं, तो हमें यथासंभव प्रतिबंधित होना चाहिए, केवल स्थानीय रूप से या हमारे निगरानी सर्वर से पहुंच को सीमित करना, सुरक्षित कुंजियों का उपयोग करना, यातायात को एन्क्रिप्ट करना, निगरानी के लिए आवश्यक न्यूनतम कनेक्शन को काम करने की अनुमति देना।
प्रदर्शन के संबंध में, निगरानी आवश्यक है, लेकिन हमारे सिस्टम के लिए इसे सुरक्षित रूप से उपयोग करना भी आवश्यक है।
हमें सावधान रहना चाहिए कि हम अनुचित रूप से उच्च डिस्क एक्सेस उत्पन्न न करें, या हमारे डेटाबेस के प्रदर्शन को नकारात्मक रूप से प्रभावित करने वाली क्वेरी न चलाएं।
यदि हमारे पास प्रति सेकंड कई लेन-देन गीगाबाइट लॉग उत्पन्न करते हैं, और हम लगातार त्रुटियों की तलाश करते रहते हैं, तो यह शायद हमारे डेटाबेस के लिए सबसे अच्छा नहीं है। इसलिए हमें जो मॉनिटर किया जाता है, कितनी बार और प्रदर्शन पर प्रभाव के बीच संतुलन रखना चाहिए।
निष्कर्ष
निगरानी को लागू करने, या इसे कॉन्फ़िगर करने के कई तरीके हैं। हम इसे जितना चाहें उतना जटिल या सरल कर सकते हैं। इस ब्लॉग का उद्देश्य आपको सबसे अधिक उपयोग किए जाने वाले ओपन सोर्स टूल में से एक का उपयोग करके पोस्टग्रेएसक्यूएल की निगरानी में पेश करना था। हमने यह भी देखा है कि विन्यास बहुत लचीला है और इसे विभिन्न आवश्यकताओं के अनुरूप बनाया जा सकता है।
और यह न भूलें कि हम हमेशा समुदाय पर भरोसा कर सकते हैं, इसलिए मैं कुछ लिंक छोड़ता हूं जो बहुत मददगार हो सकते हैं।
सहायता फ़ोरम:https://support.nagios.com/forum/
ज्ञात समस्याएँ:https://github.com/NagiosEnterprises/nagioscore/issues
Nagios प्लगइन्स:https://exchange.nagios.org/directory/Plugins
ClusterControl के लिए Nagios प्लगइन:https://severalnines.com/blog/nagios-plugin-clustercontrol